This recipe demonstrates how to use Cache Allocation Technology (CAT) to handle cache-related latency issues (cache misses) when you split a cache between cores.
Content expert: Kirill Uhanov
Ingredients
These are the hardware and software tools you need for this performance scenario:
Application:
A real-time application (RTA) with an allocated buffer that fits into Last Level Cache (LLC). The RTA reads from this buffer continuously.
RTAs are programs that function within a time frame specified by the user as immediate or current. Real-time programs must guarantee a response within specified time constraints, also known as "deadlines". There can be several reasons for missing a deadline:
- Preemptions
- Interrupts
- An unexpected latency in the critical code execution
struct timespec sleep_timeout =
     (struct timespec) { .tv_sec = 0, .tv_nsec = 10000000 };
...
buffer=malloc(128*1024);
...
run_workload(buffer,128*1024);
void run_workload(void *start_addr,size_t size) {
unsigned long long i,j;
for (i=0;i<1000;i++)
{
     nanosleep(&sleep_timeout,NULL);
     for (j=0;j<size;j+=32)
     {
        asm volatile("mov(%0,%1,1),%%eax"
            :
        :"r" (start_addr),"r"(i)
            :"%eax","memory");
     }
}
}
'Noisy Neighbors' Application: A stress-ng tool to load and stress a cache.
Tools: Intel® VTune™ Profiler - Memory Access Analysis. Set AMPLXE_EXPERIMENTAL=cat to enable the Cache Availability (preview) feature.
Note
Starting with the 2020 release, Intel® VTune™ Amplifier has been renamed to Intel® VTune™ Profiler.
Most recipes in the Intel® VTune™ Profiler Performance Analysis Cookbook are flexible. You can apply them to different versions of Intel® VTune™ Profiler. In some cases, minor adjustments may be required.
Get the latest version of Intel® VTune™ Profiler:
From the Intel® VTune™ Profiler product page.
Download the latest standalone package from the Intel® oneAPI standalone components page.
Operating system: Linux* OS
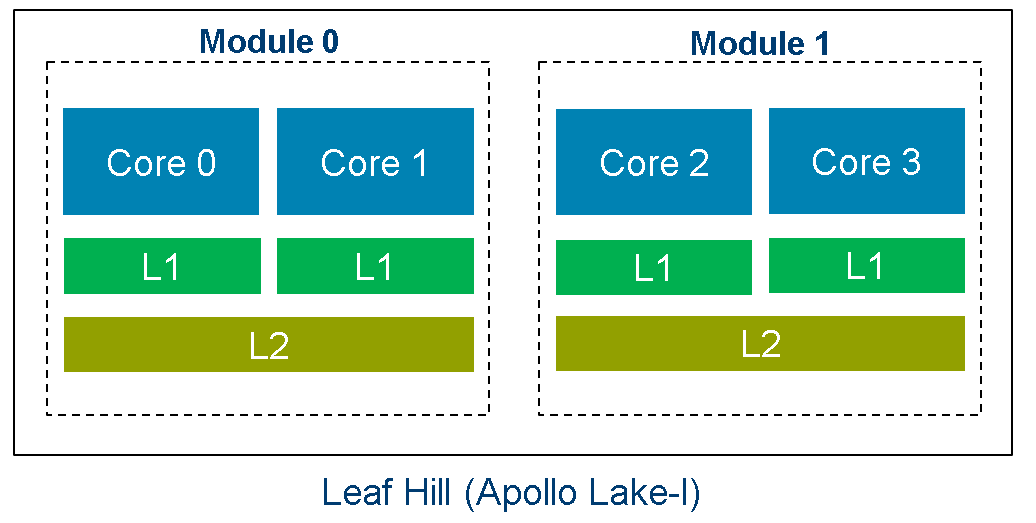
Hardware: Intel Atom® Processor E3900 Series (code named Apollo Lake) Leaf Hill with L2 CAT capabilities enabled.
Run Memory Access Analysis
When you run an RTA in a 'noisy neighbors' environment and notice performance degradation, run Memory Access analysis to investigate microarchitecture issues like CPU cache miss penalties.
In the following examples, the RTA is pinned on Core 3 while noisy neighbors are pinned on Core 2.
stress-ng -C 10 --cache-level 2 --taskset 2 --aggressive -v --metrics-brief
Both cores belong to Module 1 and share the L2 LLC.
Set AMPLXE_EXPERIMENTAL=cat to enable the Cache Availability (preview) feature.
Open the Intel® VTune™ Profiler GUI.
Create a new project. The Create a Project dialog box opens.
Specify a project name, a location for your project, and click Create Project. The Configure Analysis window opens.
In the WHERE pane, select Remote Linux(SSH) as the target system for the analysis.
Set up a passwordless connection to the Linux target.
In the WHAT pane, select Launch Application and specify your target application for analysis.
In the HOW pane, click the analysis header and select Memory Access analysis from the Analysis Tree.
Set Analyze cache allocation to catch cache segment usage by cores.
Click the Start button to launch the analysis.
Locate Cache Misses
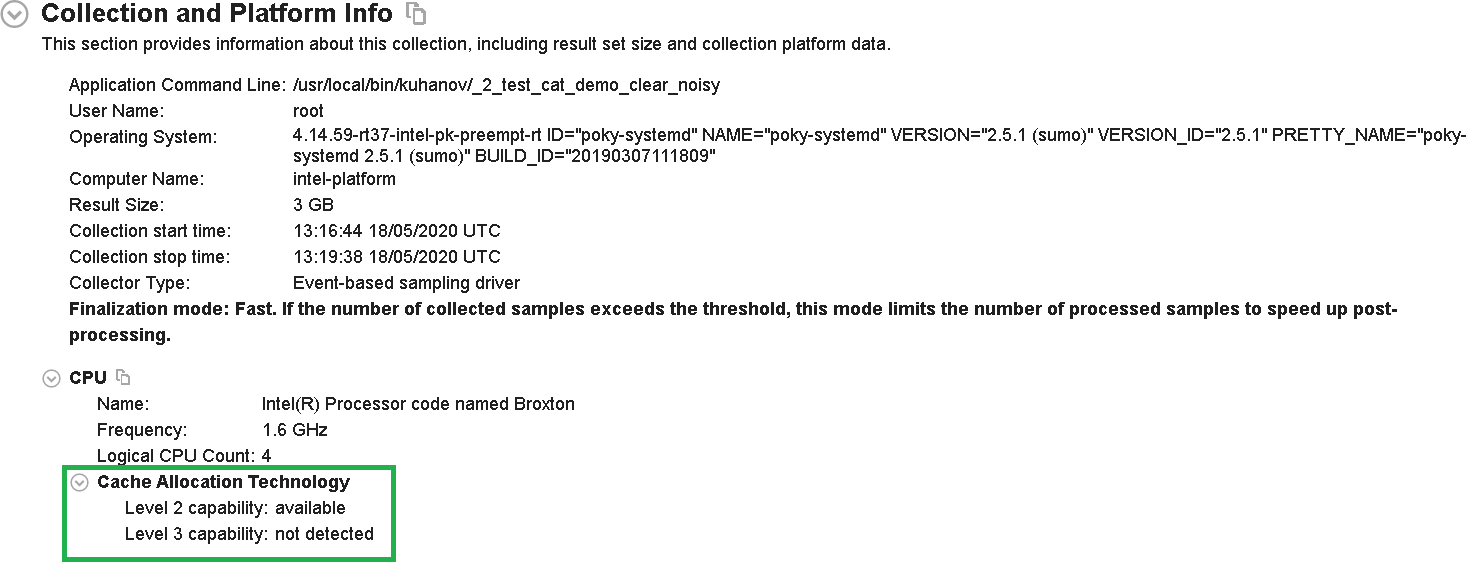
Once Intel® VTune™ Profiler completes the analysis, see the Collection and Platform Info section in the Summary pane. Here, you can see information about CPU support for L2 and L3 Cache Allocation Technology (CAT). In this example, the hardware allows for a split manipulation on LLC (L2 cache).
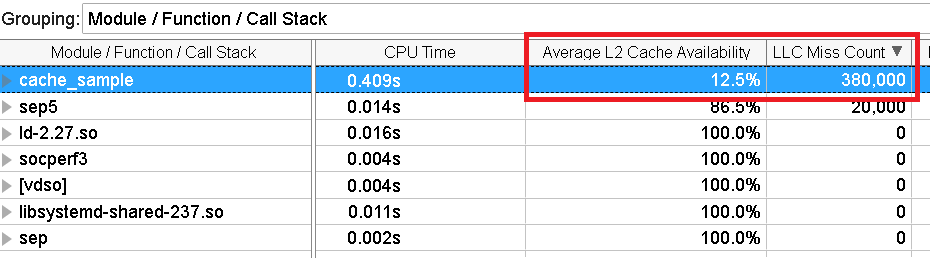
Next, switch to the Bottom-Up pane. Select Module / Function / Call Stack grouping and check the LLC Miss Count value for the cache_sample module.
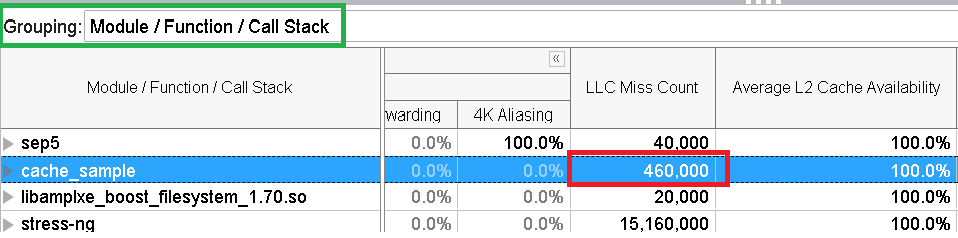
This is a high number of cache misses. However, there are zero cache misses in the absence of noisy neighbors.
Now, open the Platform pane. Group results by Logical Core/Thread and select the L2 Cache Availability checkbox.
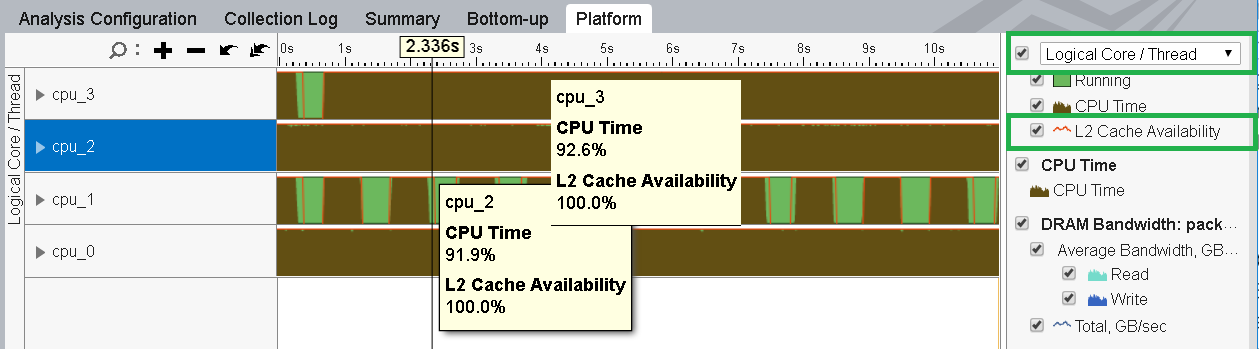
The timeline informs us that the L2 Cache Availability is 100%. This means that all segments of L2 cache were available for the entire lifetime of the target application on cpu_2. However, noisy neighbors from cpu_3 also shared the L2 cache for the entire lifetime (100%). This is an important factor responsible for the enormous amount of cache misses in the cache_sample module.
You can use CAT to split cache segments between cores so that each core has a segment for exclusive use.
Use CAT to Reorganize Cache Segments Between Cores
Split the cache to give a segment to the RTA and the rest to noisy neighbors. With CAT, you can program software to control the amount of cache used by a thread, application, virtual machine, or container. You can isolate cache segments and thereby address concerns of sharing resources. You can do this in two ways:
- Configure the MSRs directly. See Section 17.19 of the Intel® 64 and IA-32 Architectures Software Developer's Manual (Volume 3B).
- Use Resource Control (resctrl) - A kernel interface for CPU Resource Allocation.
In this example, we use Resource Control to assign:
- 1 cache segment to cpu_3.
- 7 cache segments to cpu_2.
#set '00000001' Capacity Bit Mask for CORE 3
mkdir /sys/fs/resctrl/clos0
echo 8 > /sys/fs/resctrl/clos0/cpus
echo 'L2:1=1' > /sys/fs/resctrl/clos0/schemata
#set '11111110' CBM for rest CORE
echo 'L2:1=fe' > /sys/fs/resctrl/schemata
Run Memory Access analysis again. Once the collection completes, see the Bottom-Up pane.
A small fraction of the cache (12.5%) is available exclusively. However, the count of cache misses has not improved significantly.
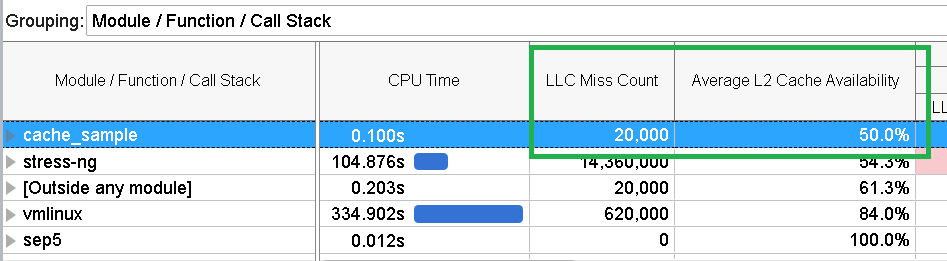
Let us devote more cache to the application and try the analysis again. Increase the cache allocation to 50% or 4 segments.
#set '00001111' Capacity Bit Mask for CORE 3
mkdir /sys/fs/resctrl/clos0
echo 8 > /sys/fs/resctrl/clos0/cpus
echo 'L2:1=f' > /sys/fs/resctrl/clos0/schemata
#set '11110000' CBM for rest CORE
echo 'L2:1=f0' > /sys/fs/resctrl/schemata
With increased cache allocation, the Bottom-Up pane shows that the count of cache misses has reduced significantly. But this comes at a price since we have now dedicated one half of the entire available cache for the application exclusively.
It is possible that the exit is in the use of Pseudo-Locking technique. Pseudo-locking helps to protect data eviction from the cache by other processes that attempt to use the same cache. The RTA can allocate critical data to a special segment of the cache and protect it from use by another thread, process, or core. While the segment is hidden, we still have access to data in the segment.
#Create the pseudo-locked region with 1 cache segment
mkdir /sys/fs/resctrl/demolock
echo pseudo-locksetup > /sys/fs/resctrl/demolock/mode
echo 'L2:1=0X1' > /sys/fs/resctrl/demolock/schemata
cat /sys/fs/resctrl/demolock/mode
pseudo-locked
struct timespec sleep_timeout =
(struct timespec) { .tv_sec = 0, .tv_nsec = 10000000 };
...
/* buffer=malloc(128*1024); */
open("/dev/pseudo_lock/demolock",0_RDWR);
buffer=mmap(0,128*1024,PROT_READ|PROT_WRITE,MAP_SHARED,dev_fd,0);
...
run_workload(buffer,128*1024);
void run_workload(void *start_addr,size_t size) {
unsigned long long i,j;
for (i=0;i<1000;i++)
{
nanosleep(&sleep_timeout,NULL);
for (j=0;j<size;j+=32)
{
asm volatile("mov(%0,%1,1),%%eax"
:
:"r" (start_addr),"r"(i)
:"%eax","memory");
}
}
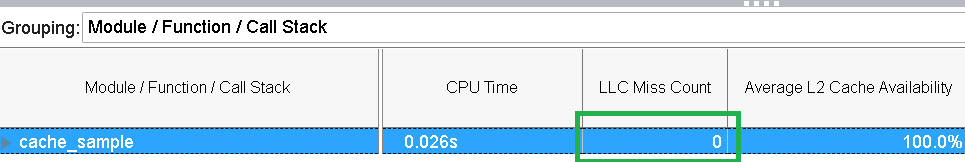
}Run the analysis again. Open the Bottom-Up pane to see results.
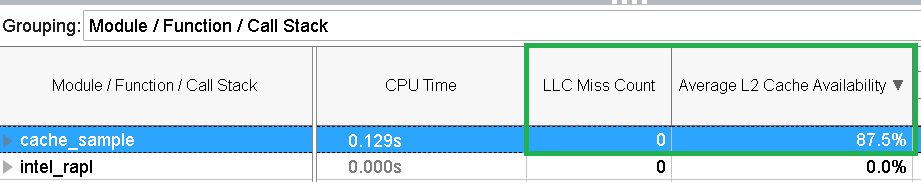
Locking just a single segment on the system helped to resolve all of the cache misses.
Cache Allocation Technology is very useful in real-time environments or workloads where a small latency (caused by memory accesses) is critical, irrespective of its size. As described in this recipe, allocate cache segments in iterative runs until you observe zero cache misses.
Note
Discuss this recipe in the Analyzers developer forum.