This recipe introduces PCIe Bandwidth metrics used in Intel® VTune™ Profiler to explore the PCIe traffic for a packet forwarding DPDK-based workload.
Content expert: Ilia Kurakin, Roman Khatko
Data plane applications running on systems with 10/40 GbE NICs usually highly utilize platform I/O capabilities, in particular, intensively consume the bandwidth of the PCIe link that is an interface between the CPU and Network Interface Card (NIC). For such workloads, it is critical to effectively utilize the PCIe link by keeping the balance between packet transfers and control communications. Understanding PCIe transfers helps locate and fix performance issues.
For detailed methodology of the PCIe performance analysis for DPDK-based workloads, see Benchmarking and Analysis of Software Data Planes.
In this recipe, you can explore the stages of packet forwarding with DPDK and theoretical estimations for PCIe bandwidth consumption. Then, you can compare the theoretical estimations with the data collected with Intel® VTune™ Profiler.
DIRECTIONS:
Ingredients
This section lists the hardware and software tools used for the recipe.
Application: DPDK testpmd app running on one core and performing L2 forwarding. The application is compiled against DPDK with profiling enabled by Intel® VTune™ Profiler.
Performance analysis tools:
- Intel® VTune™
Profiler 2019 Update 3: Input and Output analysis.
Note
Starting with the 2020 release, Intel® VTune™ Amplifier has been renamed to Intel® VTune™ Profiler.
Most recipes in the Intel® VTune™ Profiler Performance Analysis Cookbook are flexible. You can apply them to different versions of Intel® VTune™ Profiler. In some cases, minor adjustments may be required.
Get the latest version of Intel® VTune™ Profiler:
From the Intel® VTune™ Profiler product page.
Download the latest standalone package from the Intel® oneAPI standalone components page.
- Intel® VTune™
Profiler 2019 Update 3: Input and Output analysis.
System setup: a traffic generator and a system under test, where the testpmd app performs packet forwarding and where Intel® VTune™ Profiler collects performance data.
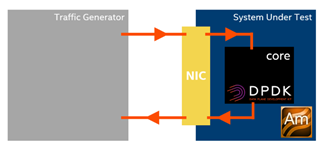
CPU: Intel® Xeon® Platinum 8180 (38.5M Cache, 2.5 GHz, 28 cores)
Understand Inbound / Outbound PCIe Bandwidth Metrics
PCIe transfers may be initiated by both the PCIe device (for example, NIC) and the CPU. So, Intel® VTune™ Profiler distinguishes PCIe bandwidth metrics for the following bandwidth types:
Inbound PCIe Bandwidth caused by device transactions targeting the system memory
Inbound Reads show device reads from the memory
Inbound Writes show device writes to the memory
Outbound PCIe Bandwidth caused by CPU transactions targeting device's MMIO space
Outbound Reads show CPU reads from device's MMIO space
Outbound Writes show CPU writes to the device's MMIO space
Configure and Run Input and Output Analysis
To collect Inbound and Outbound PCIe Bandwidth data, use the Input and Output analysis.
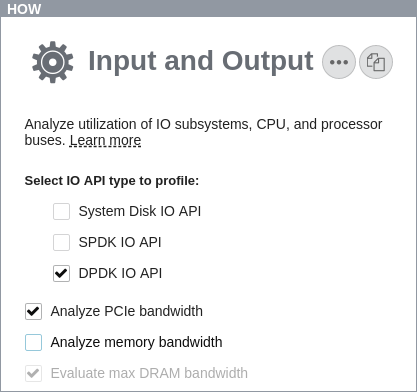
In the GUI, create a project, select the Input and Output analysis on the HOW pane, and enable the Analyze PCIe bandwidth option:
In the command line, use the collect-pcie-bandwidth knob, which is set to true by default. For example, the following command starts the collection of PCIe Bandwidth data along with DPDK metrics:
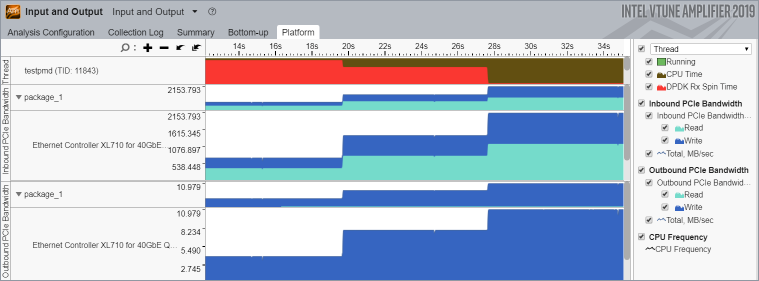
amplxe-cl -collect io -knob kernel-stack=false -knob dpdk=true -knob collect-memory-bandwidth=false --target-process my_processIn the Intel® VTune™ Profiler GUI in the collected result, navigate to the Platform tab and focus on the Inbound and Outbound PCIe Bandwidth sections.
Note
Starting with server platforms based on the Intel microarchitecture code name Skylake, PCIe Bandwidth metrics can be collected per-device. Root privileges are required.
Understand PCIe Transfers Required for Packet Forwarding
Packet forwarding with DPDK implies receiving a packet (rx_burst DPDK routine) followed by transmitting the packet (tx_burst). The Core Utilization in DPDK Apps recipe describes details of packet receiving by means of Rx queue containing Rx descriptors. Packet transmitting with DPDK works similarly to packet receiving. To transmit packets, a working core employs Tx descriptors - the 16-Byte data structures that store a packet address, size, and other control information. The buffer of Tx descriptors is allocated by the core in the contiguous memory and is called Tx queue. Tx queue is handled as a ring buffer and is defined by its length, head, and tail. Packet transmitting from the Tx queue perspective is very similar to the packet receiving: the core prepares new Tx descriptors at the Tx queue tail, and the NIC processes them starting from the head.
For both Rx and Tx queues, the tail pointers are updated by the software to notify the hardware that new descriptors are available. The tail pointers are stored in the NIC registers that are mapped to the MMIO space. So, the tail pointers are updated through Outbound Writes (MMIO Writes). MMIO address space is uncacheable, so Outbound Writes, and especially Outbound Reads, are very expensive transactions and, therefore, such transfers should be minimized.
For packet forwarding, PCIe transactions go through the following workflow:
The core prepares the Rx queue and starts polling the Rx queue tail.
The NIC reads an Rx descriptor in the Rx queue head (Inbound Read).
The NIC delivers the packet to the address specified in the Rx descriptor (Inbound Write).
The NIC writes back the Rx descriptor to notify the core that the new packet arrived (Inbound Write).
The core processes the packet.
The core frees the Rx descriptor and moves the Rx queue tail pointer (Outbound Write).
The core updates the Tx descriptor in the Tx queue tail.
The core moves the Tx queue tail pointer (Outbound Write).
The NIC reads the Tx descriptor (Inbound Read).
The NIC reads the packet (Inbound Read).
The NIC writes back the Tx descriptor to notify the core that the packet is transmitted and the Tx descriptor can be freed (Inbound Write).
Understand PCIe Traffic Optimizations
To increase the maximum packet rate and reduce the latency, the DPDK uses the following optimizations:
No Outbound Reads. No expensive Outbound Reads (MMIO Reads) are needed to understand Rx and Tx queues head position. Instead, the NIC writes back Rx and Tx descriptors to notify software that the head position moves.
Decreased Inbound Write Bandwidth related to the Tx descriptors. Tx descriptor write back is required to notify the core where the Tx queue head is and which Tx descriptors can be reused. In case of packet receiving, it is critical to write back each Rx descriptor to notify the core about a new arrived packet as soon as possible. In packet transmitting, there is no need to write back each Tx descriptor. It is sufficient to notify the core about successful packet transmission periodically (for example, on every 32nd packet), which would mean that all previous packets are transmitted successfully too. The NIC writes back the Tx descriptor when the RS (Report Status) bit of the Tx descriptor is set. On the DPDK side, there is a RS bit threshold; its value defines how frequently the RS bit is set and thus how frequently the NIC writes back Tx descriptors. This optimization amortizes Inbound Writes related to the Tx descriptors.
Amortized Outbound Writes. The DPDK performs packet receiving and transmitting in batches, and application updates tail pointers after a batch of packets has been processed. Some implementations of rx_burst use the Rx free threshold. This threshold enables setting the number of Rx descriptors processed before the app updates the Rx queue tail pointer (note that threshold becomes effective only when it is greater than the batch size). That way, the Outbound Writes are averaged among a number of packets.
Besides, at the platform level all the transactions are performed at the cache line granularity, so the hardware always tries to coalesce reads and writes to avoid partial cache line transfers.
Estimate PCIe Bandwidth Consumption
For the packet forwarding case with optimizations described above, you can apply the following equations estimating PCIe bandwidth consumption at the given packet rate:


The equation for Outbound Write Bandwidth above works only when the packets are processed with the batches of the same size. This formula should be more accurate if packets are transmitted with batches of multiple sizes.
In the simple forwarding case, the core transmits all the received packets. The testpmd is an application designed within run-to-completion model, so you can assume that tx_burst operates with the same batches of packets as rx_burst does. In other words, the Rx Batch Histogram (see the Core Utilization in DPDK Apps recipe) reflects the statistics of both packet receiving and packet transmitting. Therefore, you can use the Rx Batch Histogram to estimate Outbound Write Bandwidth in a generic case.
Instead of the Tx batch size consider an "average" Tx batch size:

where  is the batch size,
  - the number of rx_burst calls with batch size
  ,
,  – the number of packets in the ith peak of the
Rx Batch Histogram and
– the number of packets in the ith peak of the
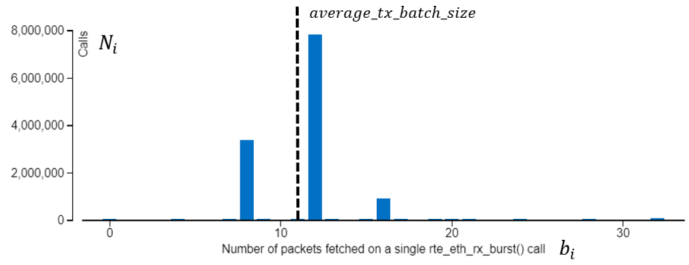
Rx Batch Histogram and  is the total number of packets forwarded. The picture below illustrates this calculation. For this example, the batch histogram has 3 peaks with batch sizes of 8, 10 and 12, and the calculation provides an average batch size equal to 11.
For simplicity, consider Rx free thresholds greater that maximal Rx batch size. Then, the final equation for Outbound Write bandwidth is the following:

Compare Estimations vs. Analysis
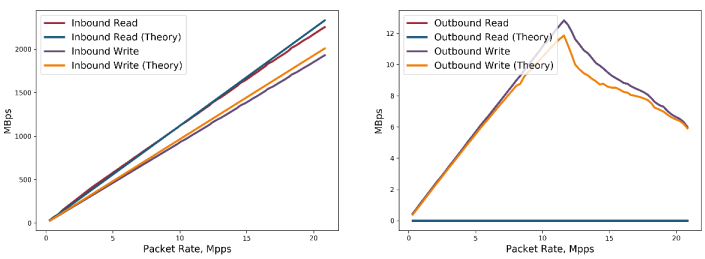
The charts illustrate a theoretical estimation for PCIe bandwidth and the PCIe bandwidth collected with Intel® VTune™ Profiler for the testpmd app configured as listed in the table below.
Packet Size, B |
64 |
Rx Descriptor Size, B |
32 |
RS Bit Threshold |
32 |
Rx Free Threshold |
32 |
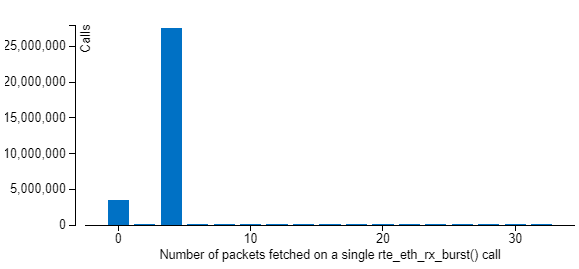
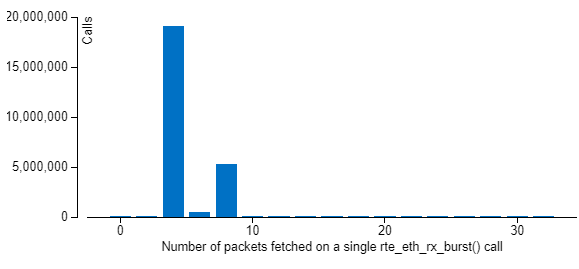
The fracture in the middle of the Outbound Write dependency looks interesting. This drop is a consequence of the Batch Histogram modification caused by processing of the increased packet rate. Before this point, the Batch Histogram has only two peaks - with batch sizes 0 and 4, and at this point a new peak of 8 appears (see the histograms below). According to the equations listed above, this increases an average batch size and leads to reducing the Outbound Write Bandwidth.
For 10 Mpps:
For 13 Mpps:
In general, theoretical estimations look very close to the data reported by Intel® VTune™ Profiler, though there are some deviations that may be caused by effects that are not taken into account in equations.
The data plane application used in this recipe is already well-optimized; however, the demonstrated recipe is a solid starting point for I/O-centric performance analysis of real world application.