This recipe explores profiling a front-end-bound application using the General Exploration analysis of the Intel® VTune™ Amplifier and using a PGO option to reduce ICache misses.
Content expert: Dmitry Ryabtsev
DIRECTIONS:
Note
General Exploration analysis was renamed to Microarchitecture Exploration analysis staring with Intel VTune Amplifier 2019.
Ingredients
This section lists the hardware and software tools used for the performance analysis scenario.
Application: a test sample based on sqlite database. The application is used as a demo and not available for download.
Tools:
Intel VTune Amplifier 2018: General Exploration analysis
Note
Starting with the 2020 release, Intel® VTune™ Amplifier has been renamed to Intel® VTune™ Profiler.
Most recipes in the Intel® VTune™ Profiler Performance Analysis Cookbook are flexible. You can apply them to different versions of Intel® VTune™ Profiler. In some cases, minor adjustments may be required.
Get the latest version of Intel® VTune™ Profiler:
From the Intel® VTune™ Profiler product page.
Download the latest standalone package from the Intel® oneAPI standalone components page.
Intel® C++ Compiler
Operating system: Microsoft* Windows* 7
CPU: Intel® microarchitecture code named Skylake
Run General Exploration Analysis
To have a high-level understanding of potential performance bottlenecks for the sample, start with the General Exploration analysis provided by the VTune Amplifier:
Click the
 New Project button on the toolbar and specify a name for the new project, for example:
sqlite.
New Project button on the toolbar and specify a name for the new project, for example:
sqlite.
In the Analysis Target window, select the local host target system type for the host-based analysis.
Select the Launch Application target type and specify an application for analysis on the right.
Click the Choose Analysis button on the right, select Microarchitecture Analysis > General Exploration and click Start.
VTune Amplifier launches the application, collects data, finalizes the data collection result resolving symbol information, which is required for successful source analysis.
Identify Hardware Hotspots
General Exploration analysis helps you see dominant performance bottlenecks in your code. Start your analysis with the Summary view that displays application-level statistics per hardware metrics. Focus on the flagged performance issues:
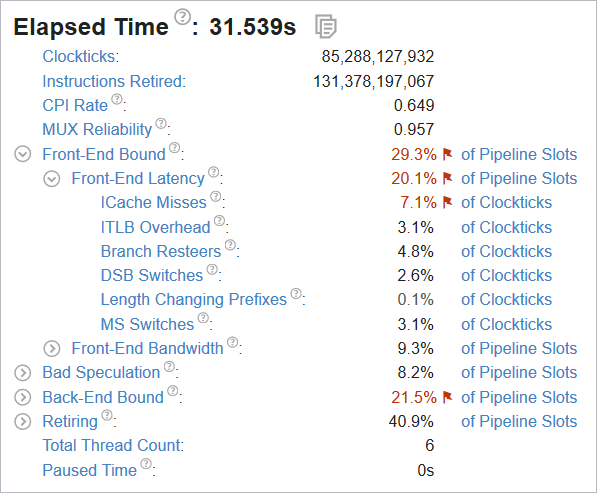
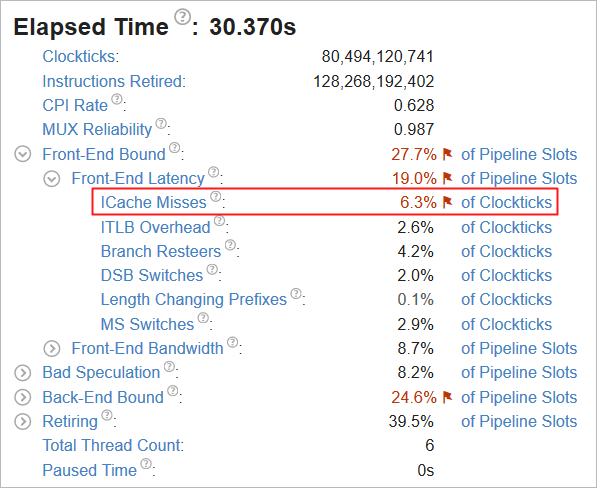
The sample application is front-end bound (29.3% of Pipeline Slots) with the instruction cache misses as a dominant bottleneck (7.1% of Clockticks).
Switch to the
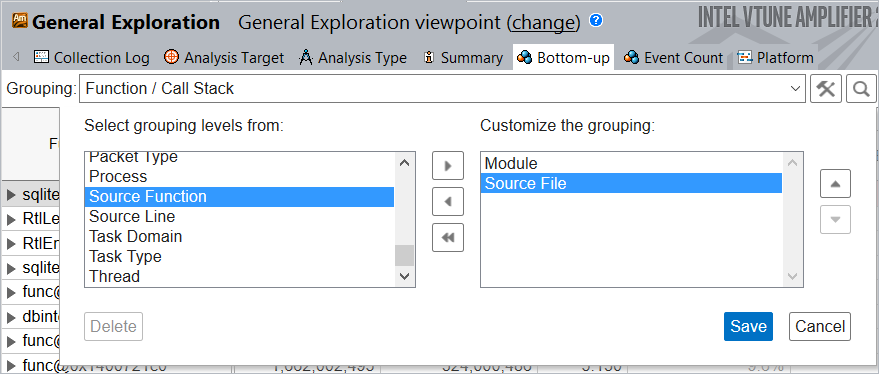
Bottom-up tab to locate the issue in the code. Click the
 Customize Grouping button next to the
Grouping toolbar and create a new custom grouping
Module/Source File:
Customize Grouping button next to the
Grouping toolbar and create a new custom grouping
Module/Source File:
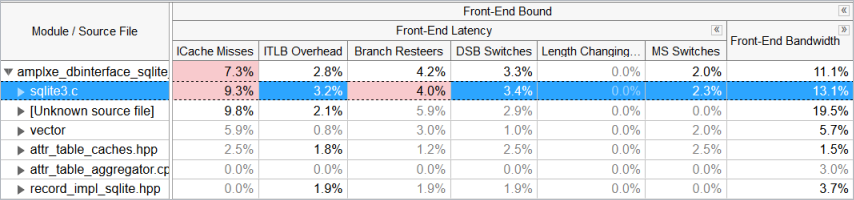
The new grouping applied to the collected results shows that sqlite3.c file is the main hotspot taking the most of CPU cycles to execute:
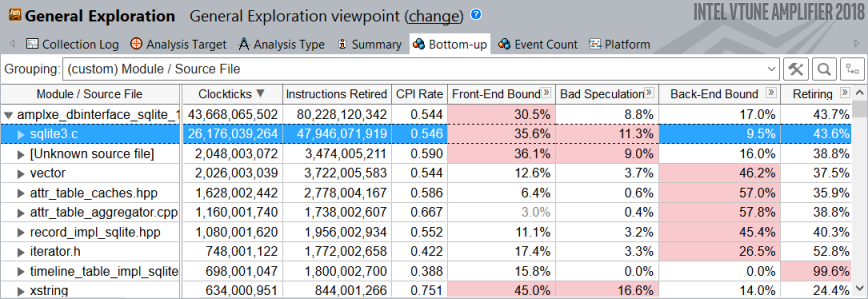
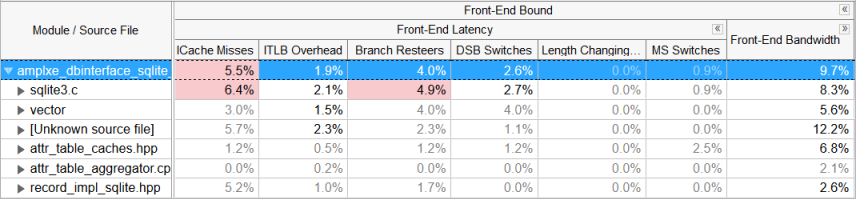
Navigating to the ICache Misses metric also discovers the highest value for the sqlite3.c file:
Re-compile Your Code with PGO
Use Intel® C++ Compiler to apply the Profile Guided Optimization (PGO) to the sqlite library:
Recompile your code with the /Qprof-gen option.
Run the benchmark.
Re-compile the code with the /Qprof-use option.
For more details, see the Profile-Guided Optimizations Overview.
Verify Optimization
Re-run the General Exploration analysis on the optimized code. The new result shows 30.3 seconds of Elapsed time, which is an almost 4% improvement to the original 31.5 seconds:
The number of clockticks stalled due to ICache Misses for the sqlite library has reduced to 6.4% from 9.3%: